
Key Fact
The system of sensors needed to be highly adaptable and configurable in order that multiple systems could be tested
Testimonials
TBG Solutions delivered a reconfigurable, expandable and synchronised data logging network for full scale tidal turbine power train testing.
Understand
The Challenge
Creating a hardware and software test solution to allow full control of specialised Drillpipe inspection units.
The Solution
Using NI LabVIEW, a cDAQ-9174 Chassis with 1 x NI 9239 and 2 x NI 9403 modules, a customised TBG PCB and wiring harness allowed for full control of the hardware interface (Figure 3). This enabled the client to perform, monitor and record a number of tests including transverse flaw detection and wall loss detection.
Introduction
Drill pipe inspection is an important process that helps to maintain the safety and reliability of piping operations. Our customer are continuously looking for ways in which they can improve their products. Upon identifying the need for a new system, they developed a hardware interface which encapsulated two inspection capabilities. However, they needed an underlying software & hardware solution to truly improve the inspection process. They chose TBG Solutions to challenge the issue.

Engineer
System Overview
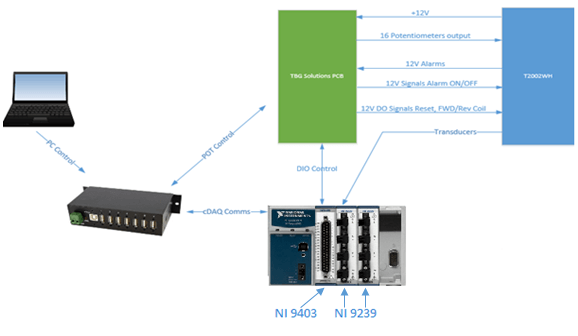
The system consists of a hardware interface with various physical switches and knobs which connects to the TBG PCB housing via various inputs and outputs. This included potentiometer outputs and alarm signals. The PCB I/O is controlled via the NI 9403 module in the cDAQ-9174 chassis which then connects to the PCB. The hardware interface also connects to the NI 9239 module which provides an input for the transducers. The cDAQ-9174 is connected to the control PC which enables the system to continuously send and receive data. Figure 1 is a graph outlining the physical connections between the described components.
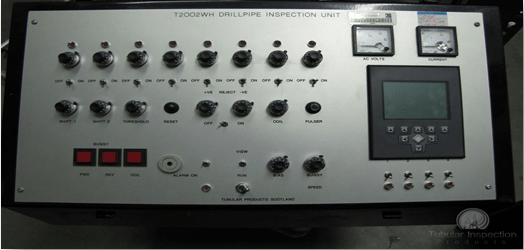
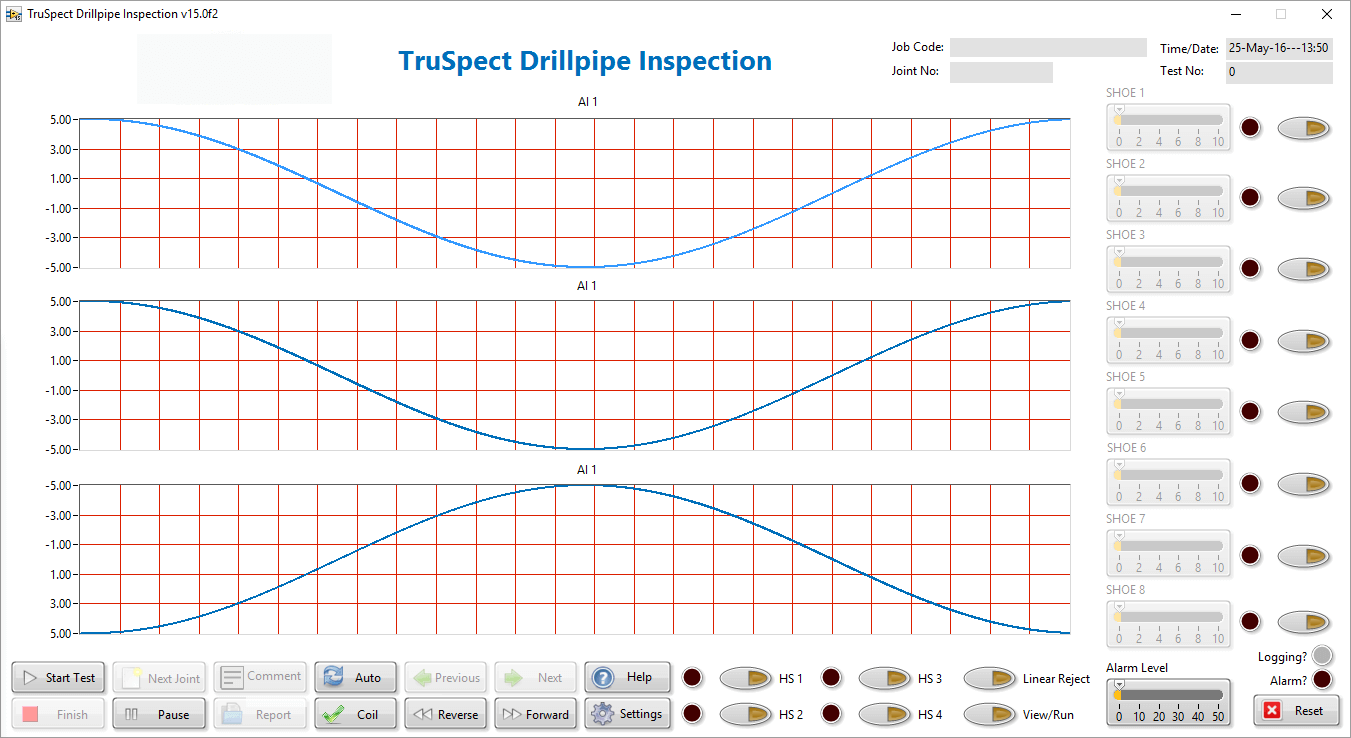
The software was developed in LabVIEW and uses various tools which are explained later in the case study. The software receives data from the coil transducers and the Hall Effect sensor and plots it onto graphs located on the main interface. Furthermore, the front panel controls provide an interface for controlling the physical components seen in Figure 2.
Implementation
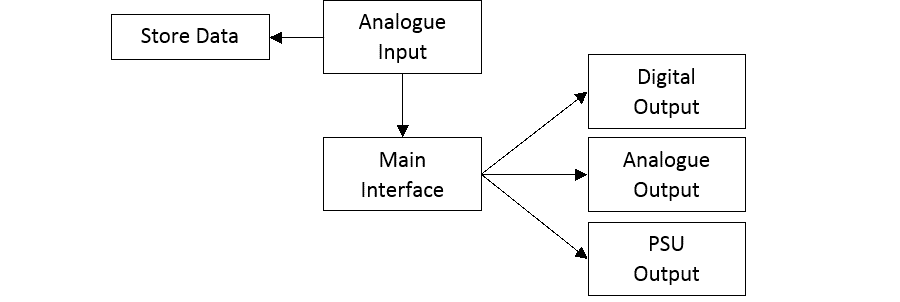
We designed the software to continuously receive data from the analogue inputs whilst offering the ability to manage the inspection unit through various digital and analogue outputs – all from a centralised location.
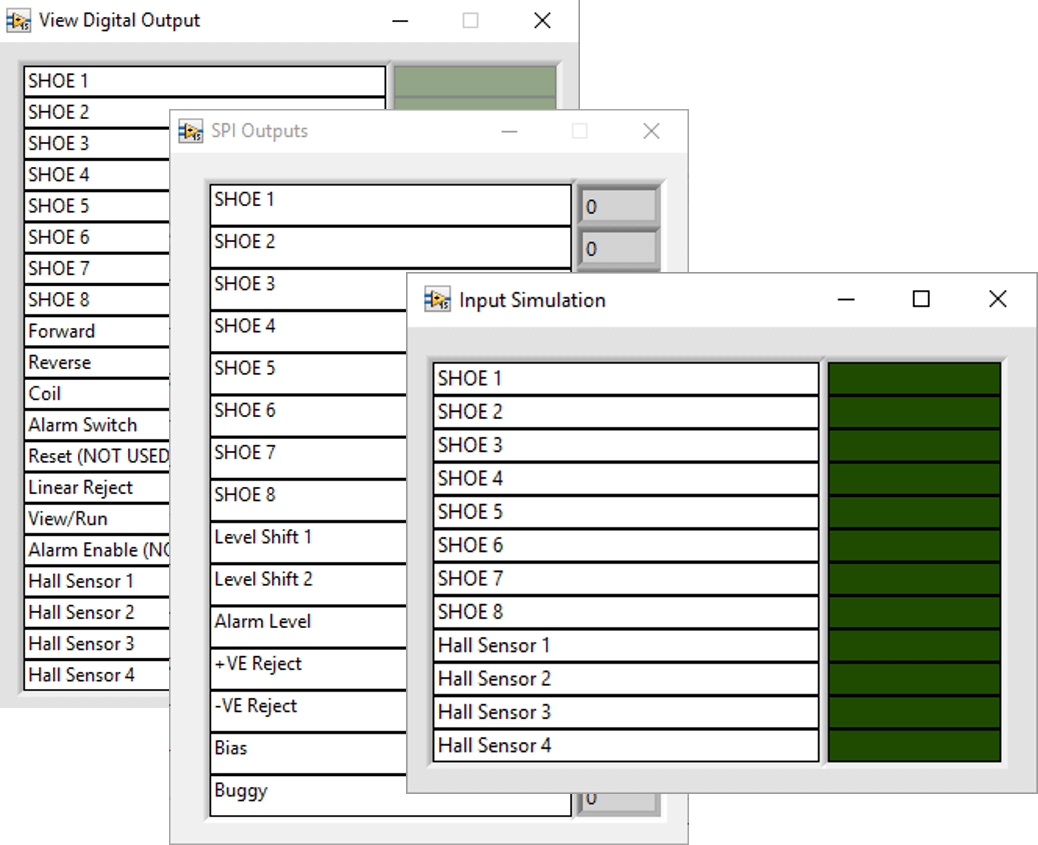
We used LabVIEW’s Object-Oriented Programming (OOP) architecture as this was an ideal tool to encapsulate each I/O type and create additional instances that could be dynamically dispatched inside the code. Using the OOP architecture increased the ease of development allowing us to produce simulation classes. This provided an I/O testing platform (Figure 4) for validating functionality throughout the development process and also allowed us to highlight any bugs that had been introduced. Due to the nature of the project, it was not viable for TBG to have access to the inspection hardware. By implementing the simulation classes, we were able to produce and test the software off-site, lowering the development costs and resolving any issues without having to involve the client.
Another invaluable tool that LabVIEW OOP offers is a graphical class hierarchy view (Figure 5) which enabled us to easily develop a Hardware Abstraction Layer (HAL). This greatly benefited the solution and allowed us to program the software in a way that would match the modularity of the NI hardware setup. This allowed us to accommodate potential software and hardware changes as new child classes, modifying the functionality without having to explicitly change the overall software.

Operator PC Interface
We used a number of LabVIEW front panel elements to achieve the full functionality required by the client. LabVIEW’s front panel tools allowed for the complex interface to be organised quickly and professionally while not compromising the ease of use. The front panel was divided using a tab control, allowing the user to quickly switch between screens of neatly organised controls and indicators. Furthermore, the ability to customise controls made the program more intuitive and straight-forward in use as each button was personalised with a unique icon.
Deliver
Producing this solution required both hardware and software capable of interfacing with a number of inspection units. Using NI LabVIEW, a cDAQ-9174 Chassis with 1 x NI 9239 and 2 x NI 9403 modules and a customised TBG PCB and wiring harness, TBG were able to create a flexible and expandable solution capable of accommodating future changes in our customers requirements. Our solution enabled the monitoring of drill pipes, identifying defects before failure and possible damage.

